and rename documentation links from .html to .md, since
markdown-gradle-plugin will now automatically transfer the links .md to
.html.

Now users can broswe the documentation in their markdown form (e.g. via
github) and via html.

Also add a symlink from README.md to index.md in documentation/.
3.3 KiB
Debugging with Smack
Smack includes two built-in debugging consoles that will let you track
all XML traffic between the client and server. A lite debugger and an
enhanced debugger contained in smack-debug.jar, and a console debugger in smack-core.jar.
Debugging mode can be enabled in two different ways:
- Add the following line of code before creating new connections:
SmackConfiguration.DEBUG = true;
- Set the Java system property
smack.debugEnabledto true. The system property can be set on the command line such as:
java -Dsmack.debugEnabled=true SomeApp
If you wish to explicitly disable debug mode in your application, including using the command-line parameter, add the following line to your application before opening new connections:
SmackConfiguration.DEBUG = false;
Smack uses the following logic to decide the debugger console to use:
- It will first try use the debugger class specified in the Java system property
smack.debuggerClass. If you need to develop your own debugger, implement theSmackDebuggerinterface and then set the system property on the command line such as:
java -Dsmack.debuggerClass=my.company.com.MyDebugger SomeApp
-
If step 1 fails then Smack will try to use the enhanced debugger. The file
smackx-debug.jarcontains the enhanced debugger. Therefore you will need to place the jar file in the classpath. For situations where space is an issue you may want to only deploysmack-core.jarin which case the enhanced and lite debugger won't be available, but only the console debugger. -
The last option if the previous two steps fail is to use the console debugger. The console debugger is a very good option for situations where you need to have low memory footprint.
Enhanced Debugger
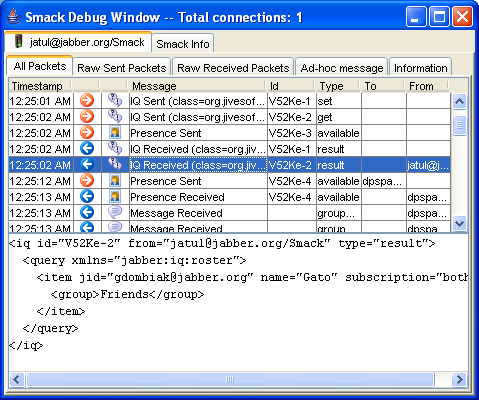
 When debugging mode is
enabled, a debug window will appear containing tabs for each new created
connection. The window will contain the following information:
- XMPPConnection tabs -- each tab shows debugging information related to the connection.
- Smack info tab -- shows information about Smack (e.g. Smack version, installed components, etc.). The connection tab will contain the following information:
- All Stanzas -- shows sent and received packets information parsed by Smack.
- Raw Sent Stanzas -- raw XML traffic generated by Smack and sent to the server.
- Raw Received Stanzas -- raw XML traffic sent by the server to the client.
- Ad-hoc message -- allows to send ad-hoc packets of any type.
- Information -- shows connection state and statistics.
Lite Debugger
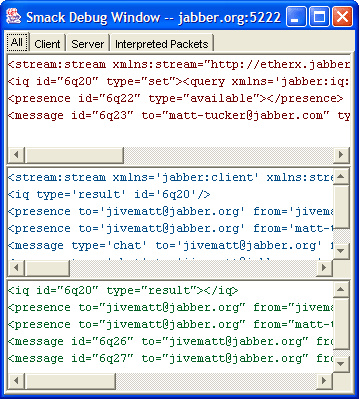
 When debugging mode is enabled, a
debug window will appear when each new connection is created. The window will
contain the following information:
- Client Traffic (red text) -- raw XML traffic generated by Smack and sent to the server.
- Server Traffic (blue text) -- raw XML traffic sent by the server to the client.
- Interpreted Stanzas (green text) -- shows XML packets from the server as parsed by Smack. Right click on any of the panes to bring up a menu with the choices to copy of the contents to the system clipboard or to clear the contents of the pane.
Copyright (C) Jive Software 2002-2008